This post describes how to monitor logs in kubernetes with grafana and loki. This covers the use case of logging for troubleshooting purposes. That is, it allows analysing human readable logs coming from multiple systems in one aggregated log. Human readable logs are required for troubleshooting and optimization. It is the bare minimum of logging that is required.
Another use case is event logging where log entries are parsed and put into a structured form before being stored. The latter type of logs can be used for analytics. Examples of that use case are:
- analyzing incoming external requests and plotting their (estimated) geographical locations on a map, perhaps even filtered on user agent and/or URL.
- analyzing the actions taken by end users of a system to capture their use of a system, enhanced with non-functionals such as start time, end time, and allocated memory.
- analyzing the execution of data processing pipelines on a system over time.
So this post is about the less-adventurous case of human readable logging. A follow-up post will discuss the analytic logging use case.
As for tool choices, this post will focus on best of breed and most used tools for this use case on kubernetes, meaning fluentbit (instead of filebeat/logstash, promtail, grafana agent), loki (instead of elastic search or opensearch or druid), and grafana (instead of kibana). So in a way it is just the ELK stack but without elastic, logstash, and kibana. Then there are also commercial tools such as e.g. datadog, dynatrace, splunk that are out of scope for my home environment.
Fluentbit’s great advantage is its simplicity of configuration, its integration with kubernetes, and its support for various output destinations. Loki’s advantages are also its efficiency and small footprint. Loki is more basic in its functionality than for instance analytic tools since it only allows querying logs based on time and a limited predefined number of labels. Drill down is then done using full text search. So it does not require indexing of each log record and is thus more efficient than for instance elastic. Grafana’s advantage is its easy to understand UI and tight integration with Loki (The latter is understandable since Loki is also a grafana labs product). When we introduced grafana at work we immediately saw a productivity spike compared to kibana which has a more difficult UI. In addition, grafana is also used in combination with prometheus with is the de-facto standard for monitoring on kubernetes.
As can be seen, the whole landscape regarding observability tooling is extermely large with the explanation above focussing on just a subset of open source and commercial tools. Also, some tools have overlappiong functionality, and some companies, like grafana labs, are trying to expand beyond a visualization tool and try to provide a full observability stack. The commercial tools also try to have a focus on security but for that open source such as wazuh can also be used in combination with grafana.
Deployment
The deployment of this pipeline on kubernetes is as follows:
![PlantUML Syntax:<br />
allow_mixing<br />
scale 0.8<br />
hide circle</p>
<p>database “/var/log” as varlog<br />
database “/var/lib/docker/containers” as containerlogs<br />
database “/run/log/journal” as systemdlogs<br />
varlog -d[hidden]-> containerlogs<br />
containerlogs -d[hidden]-> systemdlogs</p>
<p>database “/data/grafana” as grafanavol<br />
database “/data/logs/loki” as lokivol</p>
<p>object “loki:ConfigMap” as lokiconfig<br />
object “fluentbit:ConfigMap” as fluentbitconfig<br />
object “k8s-label-mapping:ConfigMap” as labelconfig<br />
object “grafana:ConfigMap” as grafanaconfig</p>
<p>component “fluentbit” as fluentbit<br />
component “loki” as loki<br />
component “grafana” as grafana</p>
<p>fluentbit -> varlog<br />
fluentbit -> containerlogs<br />
fluentbit -> systemdlogs<br />
fluentbit -u-> fluentbitconfig<br />
fluentbit -u-> labelconfig</p>
<p>loki -> fluentbit<br />
loki -d-> lokivol<br />
loki -u-> lokiconfig</p>
<p>grafana -> loki<br />
grafana -d-> grafanavol<br />
grafana -u-> grafanaconfig</p>
<p>](http://www.plantuml.com/plantuml/img/RP9BRiGW38RtEGNAFgNBKHVTTDqJL5Nb04cP48XupBItBp0M0qmtaVtxymCx0oXbhb-x_95w7Hm39SZpqsdubbmG9YrJOk3WOGOdo4WlOAaowqZ0aMX7yo4gPyeDsuIbp6WFKWlhCb_ScENgD1jqAahF9bWDAiFkrtcnyupU6f69VyIfkD2VqsjNhF5Qi2vKzKmcNIqie24tHFjYr0EMSkDdanbCHgBCV1RCap7vBsz6Bt9zXwCWB2k5MbGGsi_ITsZHEtuxkKd1BDIqmt74s_GjKgpBmITq9Ah8ChCVHiUMrKZj83NIFBeE_BEveLGWSUtuSpHQUxCcL5-f2eGOwZVKXUj5f2b9dO8AJnoUxQO4L30Hdq1GlVifi_epYXxkEfRu0m00)
The deployment is quite standard, the dependency structure between the components is clear and each componet requires some configuration in the form of configmaps. Fluentbit is deployed as a Daemonset and mounts several directories of the node on which it is running. It collects the logs from there and uses the kubernetes API server to obtain metadata for the log files it is tailing. Fluentbit follows the standard output of all running containers in the cluster.
Each component is explain in more detail below.
Fluentbit
Fluentbit runs In kubernetes as a DaemonSet and mounts several standard logs directories such as /var/log. It then tails the logs found there based on its configuration and uses the API server to get the metadata for the collected log files. Each entry in a given log file is then enhanced with the metadata found. Most importantly, fluentbit adds labels to each log entries which can be used as search keys. As mentioned earlier, loki is not an analytics engine: querying is limited to time intervals and the assigned labels and full text search is used after that.In this way, the role of fluentbit is most similar to filebeat (part of the ELK stack) which also adds metadata to log entries. The result of this is a JSON file that contains the log entry as well as metadata and labels.
For instance, the log line
11.22.33.44, 10.100.208.16 10.200.208.8 - user1 [09/Jan/2023:20:26:00 +0000] "PROPFIND /svn/example/!svn/bc/89/trunk HTTP/1.1" 207 510 example.com
is transformed by fluentbit to the following and sent to loki:
{
  "date": "2023-01-09T20:26:00.927027Z",
  "time": "2023-01-09T21:26:00.927027683+01:00",
  "stream": "stdout",
  "_p": "F",
  "log": "11.22.33.44, 10.100.208.16 10.200.208.8 - user1  [09/Jan/2023:20:26:00 +0000] \"PROPFIND /svn/example/!svn/bc/89/trunk HTTP/1.1\" 207 510 example.com",
  "kubernetes": {
    "pod_name": "httpd-vcs-0",
    "namespace_name": "example-com",
    "pod_id": "b78bbe7e-34d9-4266-9849-98b7e2981836",
    "labels": {
      "app": "httpd-vcs",
      "controller-revision-hash": "httpd-vcs-69f4b5c7d5",
      "statefulset.kubernetes.io/pod-name": "httpd-vcs-0"
    },
    "annotations": {
      "cni.projectcalico.org/containerID": "ff97877298a26b9c378958fbfd7e8f82713e4c820f7fb476f9900baea1d7e9e4",
      "cni.projectcalico.org/podIP": "10.200.24.50/32",
      "cni.projectcalico.org/podIPs": "10.200.24.50/32"
    },
    "host": "baboon",
    "container_name": "httpd",
    "docker_id": "46a325b06e3b68c39e0a2388635ce8713fddfe128d4f8230615ecb8d4c6177e8",
    "container_hash": "registry.example.com/vcs@sha256:1107edf31f26b1188244b51c223e63a1afc5b9bc4284f85c755dae68db9c034c",
    "container_image": "registry.example.com/vcs:latest"
  }
}
As can be seen, a lot of metadata is added ny loki. In paritcular, the kubernetes section is added automatically by loki.
Installation
Fluentbit is installed using helm as follows:
# add the repo and inspect the chart
helm repo add fluent https://fluent.github.io/helm-charts
helm search repo fluent-bit
helm show values fluent/fluent-bit > fluent-values.yaml

# install it
helm upgrade --install --version 0.21.6 --namespace monitoring \
     --release-name fluent-bit fluent/fluent-bit --values fluent-values.yaml
The above command can be used for initial install as well as for upgrade.
The following values are used for configuration:
tolerations:                                             # A
- key: node-role.kubernetes.io/master
  operator: Exists

config:
  outputs: |
    [OUTPUT]                                             # B
        Name stdout
        Match *
        Format json_lines
        json_date_format iso8601

    [OUTPUT]                                             # C
        Name loki
        Match kube.*
        host loki.monitoring.svc.cluster.local
        #auto_kubernetes_labels on
        #http_user loki
        #http_passwd loki123
        label_map_path /etc/k8s_label_mapping.yaml

    [OUTPUT]                                             # D
        Name loki
        Match host.*
        host loki.monitoring.svc.cluster.local
        #http_user loki
        #http_passwd loki123
        labels host=$_HOSTNAME, service=$_SYSTEMD_UNIT

volumeMounts:
- name: config
  mountPath: /fluent-bit/etc/fluent-bit.conf
  subPath: fluent-bit.conf
- name: config
  mountPath: /fluent-bit/etc/custom_parsers.conf
  subPath: custom_parsers.conf
- name: k8s-label-mapping                                # E
  mountPath: /etc/k8s_label_mapping.yaml
  subPath: k8s_label_mapping.yaml

daemonSetVolumes:
- name: varlog
  hostPath:
    path: /var/log
- name: runlogjournal                                    # F
  hostPath:
    path: /run/log/journal
- name: varlibdockercontainers                           # G
  hostPath:
    path: /var/lib/docker/containers
- name: etcmachineid
  hostPath:
    path: /etc/machine-id
    type: File
- name: k8s-label-mapping                                # E
  configMap:
    name: k8s-label-mapping

daemonSetVolumeMounts:
- name: varlog
  mountPath: /var/log
- name: runlogjournal                                    # F
  mountPath: /run/log/journal
- name: varlibdockercontainers                           # G
  mountPath: /var/lib/docker/containers
  readOnly: true
- name: etcmachineid
  mountPath: /etc/machine-id
  readOnly: true
- # A: These tolerations make sure that DaemonSet pods also run on the controller nodes so we also get logs from pods running there
- # B: The standard output plugin can be used for debugging. It should be the first, and only, output plugin just after you have deployed fluentbit to check if it is actually finding the logs
- # C: The output used by kubernetes logs (kube.*). Note that I am not using the auto_kubernetes_labels option since the labels it adds are not convenient and are missing some essential details. Instead, I am using the label_map_path option which points to the following file that defines the labels to extract for kubernetes log entries. The label mapping JSON is defined as follows and is provided by a ConfigMap:
{
  "kubernetes": {
    "pod_name": "pod",
    "namespace_name": "namespace",
    "pod_id": "pod_id",
    "labels": {
      "app.kubernetes.io/instance": "instance",
      "app.kubernetes.io/name": "app",
      "app": "app"
    },
    "annotations": {
      "cni.projectcalico.org/containerID": "container_id",
      "cni.projectcalico.org/podIP": "pod_ip",
    },
    "host": "host",
    "container_name": "container",
    "container_image": "image"
  }
}
The paths in the mapping file match those in the JSON output shown before, and the values are the names of the labels. So this mapping extracts basic information such as pod, namespace, pod id, app label (from two different labels), container_id, pod_ip, container name, and image.
- # D: The output of host level logs. By default these are the systemd logs of the kubelet service running on each node. It is possible to collect logs of other services as well.
- # C/ # D: The host is loki.monitoring.svc.cluster.local which points to a loki service in the monitoring namespace. Note that I am not using user name and password to connect to loki. Instead I will use network policies to limit access. It is a good idea to configure authentication as soon as logs from outside the cluster are collected as well.
- # E: The k8s label mapping volume mount is for mounting the label mapping config file described above.
- # F: The /run/log/journal host path is required on RHEL/centos/rocky distributions since the standard log location /var/log is not used to store journald logs on those systems. This mount is not present in the standard fluentbit helm chart.
- # G: The container logs. On my system, I am not using docker but containerd from a docker repository so the logs are at a docker path.
Loki
Loki uses either a monolithic, simple scalable, or microservices approach. Since there is not much traffic on my cluster and I want to keep things simple I am using the monolithic approach. For production the simple scalable approach would probably be a good choice. Note however that we running on kubernetes in the cloud, the cloud provider will already have logging facilities so it would be even better to use those instead of loki.
Loki is installed using helm as follows:
helm repo add grafana https://grafana.github.io/helm-charts
helm show values grafana/loki > loki-values.yaml
helm upgrade --install --version 3.8.0 --release-name loki \
  grafana/loki --values loki-values.yaml
The values used for loki are as follows:
loki:
  auth_enabled: false

  commonConfig:
    replication_factor: 1

  storage:
    type: filesystem
  compactor:
    retention_enabled: true

test:
  enabled: false

monitoring:
  selfMonitoring:
    enabled: false

    grafanaAgent:
      installOperator: false

singleBinary:
  persistence:
    selector:
      matchLabels:
        disktype: lokidata
These values are largely self-explanatory and their definition can be found in
the output of helm show values. The persistent volume claim used by loki
has a disktype label so I am able to bind it to a specific persistent volume that I use for loki. In addition, the persistent volume I use also has a claimRef field to bind it to the PVC generated by the loki helm chart.
Grafana
Grafana installation is the simplest of all and I simply followed the instructions. This led to the following yaml file:
apiVersion: apps/v1
kind: StatefulSet
metadata:
  labels:
    app: grafana
  name: grafana
  namespace: monitoring
spec:
  serviceName: grafana
  selector:
    matchLabels:
      app: grafana
  template:
    metadata:
      labels:
        app: grafana
    spec:
      securityContext:
        fsGroup: 472
        supplementalGroups:
          - 0
      containers:
        - name: grafana
          image: grafana/grafana:9.1.0
          imagePullPolicy: IfNotPresent
          ports:
            - containerPort: 3000
              name: http-grafana
              protocol: TCP
          readinessProbe:
            failureThreshold: 3
            httpGet:
              path: /robots.txt
              port: 3000
              scheme: HTTP
            initialDelaySeconds: 10
            periodSeconds: 30
            successThreshold: 1
            timeoutSeconds: 2
          livenessProbe:
            failureThreshold: 3
            initialDelaySeconds: 30
            periodSeconds: 10
            successThreshold: 1
            tcpSocket:
              port: 3000
            timeoutSeconds: 1
          resources:
            requests:
              cpu: 250m
              memory: 750Mi
          volumeMounts:
            - mountPath: /var/lib/grafana
              name: grafana-pvc
            - mountPath: /etc/grafana/grafana.ini
              name: grafana
              subPath: grafana.ini
      volumes:
        - name: grafana
          configMap:
            name: grafana
  volumeClaimTemplates:
    - metadata:
        name: grafana-pvc
      spec:
        volumeName: grafana
        accessModes:
          - ReadWriteOnce
        resources:
          requests:
            storage: 10Gi
---
apiVersion: v1
kind: Service
metadata:
  name: grafana
  namespace: monitoring
spec:
  type: ClusterIP
  ports:
    - port: 3000
      targetPort: 3000
  selector:
    app: grafana
The only special thing in the setup is that I extracted the grafana.ini file from the container and put it in a configmap so I could modify the smtp settings and the root_url parameter to match the hostname under which grafana is exposed externally. The SMTP settings are:
[smtp]
enabled = true
host = mail.exposure:25
;user =
# If the password contains # or ; you have to wrap it with triple quotes. Ex """#password;"""
;password =
;cert_file =
;key_file =
;skip_verify = false
from_address = grafana@example.com
from_name = grafana@example
# EHLO identity in SMTP dialog (defaults to instance_name)
;ehlo_identity = dashboard.example.com
# SMTP startTLS policy (defaults to 'OpportunisticStartTLS')
startTLS_policy = NoStartTLS
In my setup, I allow mails to be sent from within the cluster using the mail service running in the exposure namespace. An essential setting was the startTLS_policy to disable TLS negotation. If you use an external mail server, it might be a good idea to configure security in a stronger way.
Viewing logs in grafana
Configure the data source using Settings/Configuration/Data Sources and then adding a Loki data source. The only setting that must be done is just http://loki:3100 since loki is running as the service loki in the same namespace as grafana.
Next, explore the dataset using the Explore menu, select a label and a value and click on run query. By default grafana will show the raw log records in JSON format with all the metadata. However, using a few filters the log line can be formatted in a more standard way:
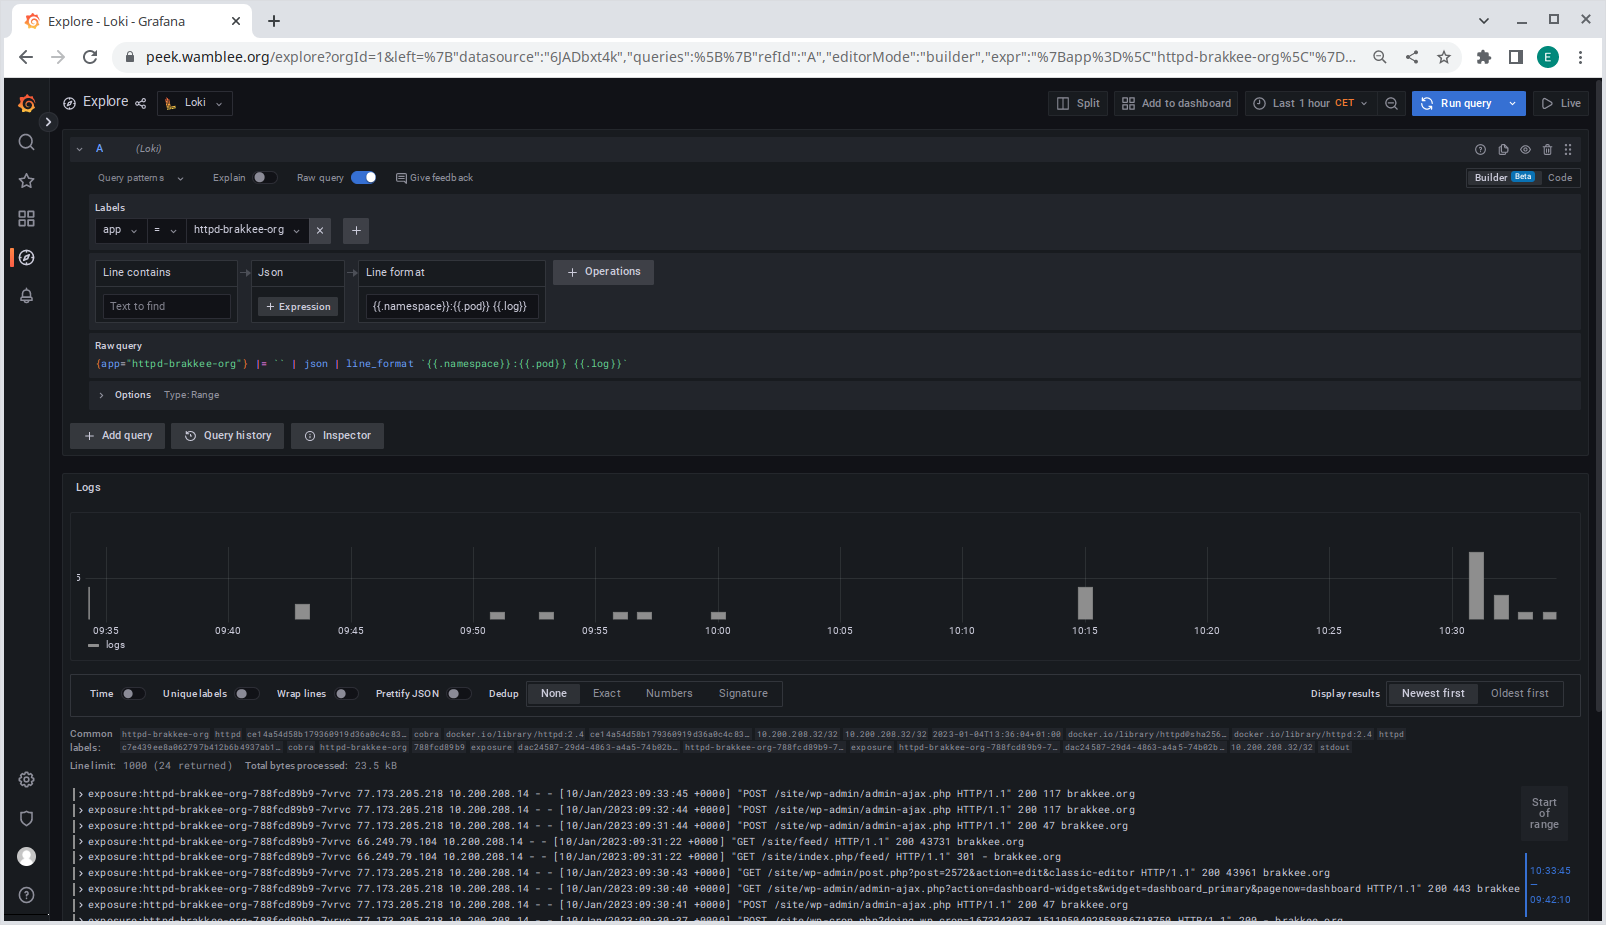
Above, I am using the JSON filter and line operation filters, the details of which you can find in the docs.
Use the JSON formatter to flatten the JSON into a set of labels. The JSON formatter flattens the JSON to flat list of key/values and the line formatter can then use the flattened JSON to format the output. In the example above I am using a format {{.namespace}}:{{.pod}} {{.log}} to show each log line prefixed with namespace and pod. Live tailing of logs is possible using the top-right Live button in the UI (see below for setup).
Live log tailing with loki
One interesting feature of loki and grafana is that it allows live log tailing. To use this feature requires a websocket connection from the web browser to grafana and from grafana to loki. The last part is easy since communication from grafana to loki is cluster internal and does not require any proxies to be configured.
For the exposure of grafana I am using my standard setup with SSL termination using ingress which then proxies to one HTTP server per domain running apache, which then demultiplexes traffic to the appropriate services using name based virtual hosts.
Here I ran into a number of issues since in both cases websocket connections did not work through ingress and also did not work through apache. For nginx, I was using the nginx-stable ingress controller which apparently did not support websockets out of the box. This problem was easily solved by using the nginx ingress controller from the kubernetes project instead which supports websocket without any additional configuration.
For apache, I had to modify my configuration following the docs as follows to rewrite websocket connections to use the websocket URL. This leads to a configuration in apache like this:
<VirtualHost *:80>
  ServerName grafana.example.com

  ProxyRequests off
  ProxyPreserveHost on
  #AllowEncodedSlashes on

  ProxyPass / http://grafana.monitoring.svc.cluster.local:3000/ disablereuse=On
  ProxyPassReverse / http://grafana.monitoring.svc.cluster.local:3000/

  RewriteEngine on
  RewriteCond %{HTTP:Upgrade} websocket [NC]
  RewriteCond %{HTTP:Connection} upgrade [NC]
  RewriteRule ^/?(.*) "ws://grafana.monitoring.svc.cluster.local:3000/$1" [P,L]
</VirtualHost>
To test websockets, I used a websocket echo server docker image and deployed it directly behind the ingress controller using a separate domain name, eliminating apache using and ingress rule. After that, that, I deployed it behind apache to test acces through both nginx and apache:
apiVersion: apps/v1
kind: Deployment
metadata:
  name: websocket-echo-server
spec:
  selector:
    matchLabels:
      app: websocket-echo-server
  template:
    metadata:
      labels:
        app: websocket-echo-server
      name: websocket-echo-server
      namespace: exposure
    spec:
      containers:
      - image: jmalloc/echo-server
        name: websocket-echo-server
        env:
          - name: PORT
            value: "8080"
          - name: LOG_HTTP_BODY
            value: yes
          #- name: SEND_SERVER_HOSTNAME
          #  value: false
        ports:
          - containerPort: 8080
            name: websocket
---
apiVersion: v1
kind: Service
metadata:
  creationTimestamp: null
  labels:
    app: websocket-echo-server
  name: websocket-echo-server
spec:
  type: ClusterIP
  ports:
  - port: 8080
    protocol: TCP
    targetPort: 8080
  selector:
    app: websocket-echo-server
Testing is done by opening the websocket service in your browser using just the domain name https://echotest.example.com for basic HTTP and https://echotest.example.com/.ws for the websocket connection.
Network policies
To obtain microsegmentation I used network policies again to allow precisely the traffic that is required. Since naming all network policy yaml definitions here would be tedious, I am listing the high level network policies I deployed in the monitoring namespace:
- default allow nothing rule as always
- allow DNS (port 53 for both UDP and TCP) for all pods in this namespace (egress)
- allow grafana to connect to loki on port 3100 (egress) and allow loki to accept connections from grafana (ingress)
- allow grafana to access grafana.com for plugin downloads (egress)
- allow grafana access from tha apache server on port 3000 (ingress) and allow apache to connect to grafana (egress)
- allow grafana to connect to the mail server running in the cluster at port 25 (egress)
- allow fluentbit to connect to loki on port 3100 (egress) and allow loki to accept connections from fluentbit (ingress)
- allow fluentbit to connect to the API server (egress)
Final thoughts
The main issue in this setup was at first to understand the data that fluentbit provides and how it accesses the logs and in relation to that how to extract intuitive kubernetes labels. In particular, I had to add a new hostpath mount for /run/log/journal to the DaemonSet to be able to monitor systemd services such as the kubelet. Additionally, I spent some hours getting websockets to work. This was challenging since the traffic had to pass through two proxies: the ingress controller and apache.